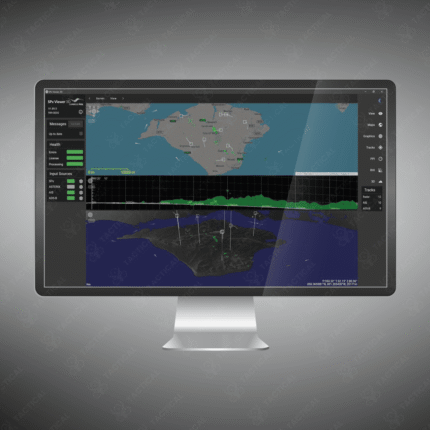
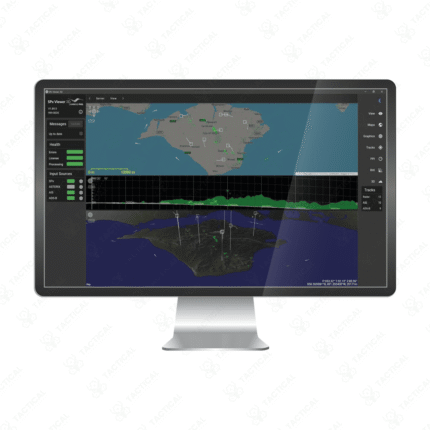
New Software Enables Visualization of Radar Data
-
Support for multiple radar video inputs or network‐formatted radar data (e.g., ASTERIX formats) allowing integration with varied sensors.
-
Real‑time visualization: display of Plan‑Position Indicator (PPI) windows, overlays including map/symbol layers, pan/zoom/resizable windows.
-
Record & replay functionality: capture radar video or data streams for offline analysis or training.
-
Browser‐based or device‐independent access: for instance, Webview by GAMIC GmbH enables radar data display in web browsers (desktop or mobile) with map underlays and multi‑window synchronization.
-
3D visualization and analytics: some tools offer volume‐radar display, isosurfaces, terrain/DEM overlays, enabling richer interpretation of data (especially for weather/meteorological or large‐area surveillance applications). Example: RadarVolumeExplorer.
-
Extensibility and integration: Software can act as a base for custom development (SDKs/APIs) so radar data visualization can be embedded into larger C2 systems or tailored GUIs. For instance, the product vsRAD offers a full API for radar echo display and integration.
Showing the single result